Filled Contour Plot
Make a filled contour plot.
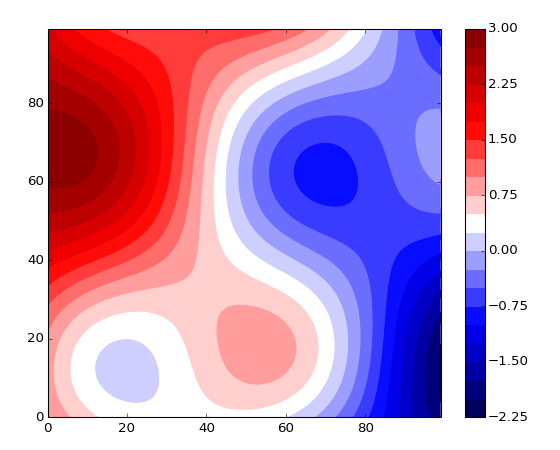
Rather than having discrete contour lines, “filled” contour plots shade the regions between contours according to a colormap. Contour lines themselves are not plotted. Use Contour Plot in combination with this VI to display lines.
The default colormap (Colormap.Map) is Rainbow.
This is a polymorphic VI; you can choose between automatically generating a specific number of contour levels (Filled Contour Plot (Automatic)) and manually specifying the contour levels you want (Filled Contour Plot (Manual)).
Data must be of shape 2x2 or larger to make a filled contour plot.
Filled Contour Plot (Automatic)
Make a filled contour plot, with N automatically chosen levels. Note that since you specify the number of levels (boundaries between regions), the number of shaded regions displayed is N+1.
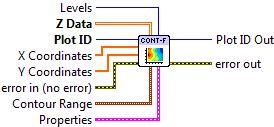

 Plot ID/Plot ID Out
- Plot identifier. Plot ID Out always contains the same value as Plot ID.
 Z Data
- 2-D array for which to generate contours. The first (slowest-varying) dimension is plotted along the Y axis; the second (fastest-varying) dimension is plotted along with X axis.
 X Coordinates
- Optional 1-D array giving X axis coordinates. Defaults to 0..NX-1, where NX is the size of Z Data‘s second dimension.
- Y Coordinates
- Optional 1-D array giving Y axis coordinates. Defaults to 0..NY-1, where NY is the size of Z Data‘s first dimension.
- Levels
- Number of contours to automatically generate (default 10). You can also set the min and max data value to contour via the Contour Range terminal.
 Contour Range
Controls the limits within which contours will be plotted.
 Min Level
- Only plot contour levels for data with this value or higher.
- Max Level
- Only plot contour levels for data with this value or lower.
 Properties
Property cluster, available under the “Properties” subpalette.
- Colormap
Controls the colormap used to display the regions.
 Map
Map- Colormap to use. See Colormaps for more info.
- Value Min
- Lower range for colormapped data; values smaller than this will all be plotted with the first color in the colormap.
- Value Max
- Upper range for colormapped data; values larger than this will all be plotted with the last color in the colormap.
- Scaling
- Colormap scaling mode. Currently only linear scaling is supported.
 Reverse
- Flip the colormap; for example, if a map has 0.0 as black and 1.0 as white, this will assign 0.0 as white and 1.0 as black.
- Display
Controls the overall appearance of the contour plot.
- Alpha
- Alpha blending value for this object (0.0 to 1.0). Default is 1.0 (fully opaque).
- Z Order
- Stacking order. Default is chosen based on the object type.

 Error In/Out
- Terminals for standard error functionality.
Filled Contour Plot (Manual)
Make a filled contour plot, with explicitly specified levels. Note that since you specify the levels (boundaries between regions), the number of shaded regions displayed is N+1.
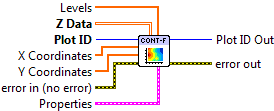
- Plot ID/Plot ID Out
- Plot identifier. Plot ID Out always contains the same value as Plot ID.
- Z Data
- 2-D array for which to generate contours. The first (slowest-varying) dimension is plotted along the Y axis; the second (fastest-varying) dimension is plotted along with X axis.
- X Coordinates
- Optional 1-D array giving X axis coordinates. Defaults to 0..NX-1, where NX is the size of Z Data‘s second dimension.
- Y Coordinates
- Optional 1-D array giving Y axis coordinates. Defaults to 0..NY-1, where NY is the size of Z Data‘s first dimension.
- Levels
- Values at which to draw region boundaries.
- Properties
Property cluster, available under the “Properties” subpalette.
- Colormap
Controls the colormap used to display the regions.
- Map
- Colormap to use. See Colormaps for more info.
- Value Min
- Lower range for colormapped data; values smaller than this will all be plotted with the first color in the colormap.
- Value Max
- Upper range for colormapped data; values larger than this will all be plotted with the last color in the colormap.
- Scaling
- Colormap scaling mode. Currently only linear scaling is supported.
- Reverse
- Flip the colormap; for example, if a map has 0.0 as black and 1.0 as white, this will assign 0.0 as white and 1.0 as black.
- Display
Controls the overall appearance of the contour plot.
- Alpha
- Alpha blending value for this object (0.0 to 1.0). Default is 1.0 (fully opaque).
- Z Order
- Stacking order. Default is chosen based on the object type.
- Error In/Out
- Terminals for standard error functionality.
Axis Types
Both Filled Contour Plot (Automatic) and Filled Contour Plot (Manual) may be used with rectangular axes only. Use with polar axes will result in 402905 - Operation Not Supported for Polar Plot. Likewise, only linear scales are supported. Use with log or symlog axes will result in 402906 - Operation Not Supported for Axis Scale.
Errors
Other information
If an empty Z Data array is provided, or an array smaller than 2x2, both VIs do nothing.
If Levels (Automatic) is 0, or (Manual) has no elements elements, no plot will be made. A negative value (Automatic) will result in the default number of contour levels being displayed. The maximum number of levels is 500. Requests for more than 500 levels will be silently clipped to 500 (Automatic), or the first 500 elements of the levels array (Manual).
If a non-finite value appears in X Coordinates or Y Coordinates, the corresponding row or column of Z Data is not displayed.
If the size of X Coordinates or Y Coordinates does not match the size of the corresponding axis for Z Data, only the overlap is displayed. A zero-sized array for either will result in the default coordinates being used (0..N-1).
A non-finite value for Contour Range.Min Level or Contour Range.Max Level will result in the default value (min or max of Z Data) being used.
A non-finite value in Z Data will appear as a “hole” or blank patch in the shaded contours.