Grid Lines
Controls display of axes box grid lines.
Grid lines originate at X and Y tick locations. New rectangular plots have grid lines turned off by default; they are on by default for polar plots.
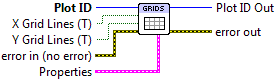

 Plot ID/Plot ID Out
- Plot identifier. Plot ID Out always contains the same value as Plot ID.
 X Grid Lines (T)
- Display grid lines originating on X tick marks. Default is True.
- Y Grid Lines (T)
- Display grid lines originating on Y tick marks. Default is True.
 Properties
Property cluster, available under the “Properties” subpalette.
 Line
LineControls appearance of the grid lines.
 Style
Style- Line style (solid, dashed, etc.). Default is to automatically select an appropriate style.
 Color
Color- Line color. May be a PlotColor or LabView color.
 Width
Width- Line width, in font points (1/72 inch).

 Error In/Out
- Terminals for standard error functionality.