Line Plot
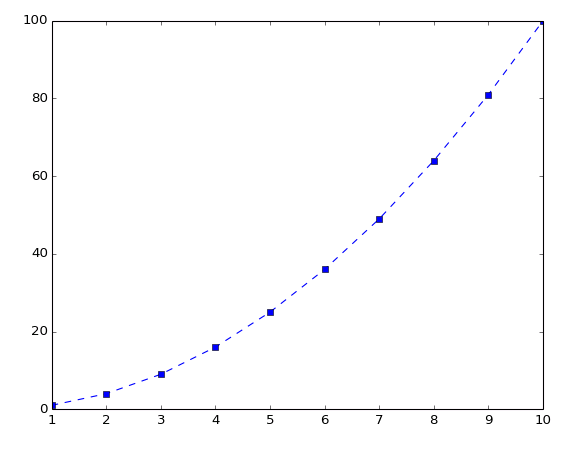
Make a line plot.
A line plot consists of a number of data points joined by a line. By default, only the line is shown; markers for the individual points are not.
Y Data is the only required input, and is a 1D array with the Y locations of the data points. If the optional X Data is not provided, an integer series 0..N-1 will be used, where N is the number of elements in Y Data.
Markers may be shown by setting Marker.Style to something other than Automatic, such as Square, Circle, etc. By default, the line and markers have the same color, determined by The Automatic Color Cycle.
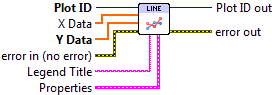

 Plot ID/Plot ID Out
- Plot identifier. Plot ID Out always contains the same value as Plot ID.
 X Data
- Optional X locations of the data points. Defaults to 0..N-1.
- Y Data
- Y locations of the data points.
 Legend Title
- Title to be displayed if a legend is added to the plot.
 Properties
Property cluster, available under the “Properties” subpalette.
 Line
LineControls the appearance of the line.
 Style
Style- Line style (solid, dashed, etc.). Default is to automatically select an appropriate style.
 Color
Color- Line color. May be a PlotColor or LabView color.
 Width
Width- Line width, in font points (1/72 inch).
- Marker
Controls the appearance of the data markers. By default, they are not shown; specify Marker.Style to change this.
- Style
- Type of marker (circle, square, etc.). Default is to select an appropriate marker.
- Color
- Marker color. May be a PlotColor or LabView color.
- Size
- Area of marker, in square points.
- Display
Controls general appearance of the line plot.
 Alpha
Alpha- Alpha blending value for this object (0.0 to 1.0). Default is 1.0 (fully opaque).
- Z Order
- Stacking order. Default is chosen based on the object type.

 Error In/Out
- Terminals for standard error functionality.
Errors
Other information
If Y Data is empty, no plot is made but the color cycle is advanced.
If a non-finite entry (NaN or Inf) appears in X Data or Y Data, the corresponding point will not be displayed.
If X Data and Y Data are different sizes, only the overlap will be displayed. If X Data is empty, the default (0..N-1) values will be used.