Add Colorbar
Add a colorbar, representing the last colormapped object plotted.
The colormap and range displayed are taken from the colormapped object. For example, if you make a filled contour plot with Filled Contour Plot and the data range from -5 to +5, the colorbar will also range from -5 to +5.
The colorbar is displayed to the right of the axis box, with an optional label. Ticks and tick labels are chosen automatically, but may be overridden if desired.
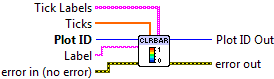

 Plot ID/Plot ID Out
- Plot identifier. Plot ID Out always contains the same value as Plot ID.
 Label
Label- If non-empty, will be used as the axis label for the colorbar.
 Ticks
Ticks- If non-empty, Colorbar axis ticks (in data units). Default is to automatically pick appropriate tick locations.
 Tick Labels
- If non-empty, labels for the colorbar axis ticks. Only used if Ticks is also provided.

 Error In/Out
- Terminals for standard error functionality.
Example
Download Colormaps and Colorbars.vi,
or see Examples for a complete list of examples.
Errors
Other information
If an entry in Ticks is non-finite (NaN or Inf), it will be ignored, along with any matching entry in Tick Labels. If all entries are non-finite, the default automatic ticks will be used. If the sizes of the two arrays don’t match, only the overlapping elements will be used.
If no colormap object is currently displayed, this VI does nothing (and no error is returned).