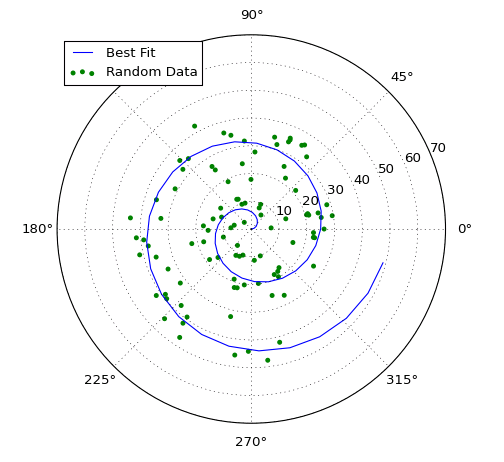
Making Polar Plots
Unlike other plotting libraries, there is no special “polar” version of VIs like Line Plot or Scatter Plot. Rather, when you create a new plot using New Plot ID, you can specify whether to use rectangular (default) axes, or polar axes. Then use the ordinary 1D plotting VIs to populate the plot.
Radians or Degrees?
Radians.
The 1D plotting VIs which can be used with polar plots (Line Plot, Scatter Plot, and Bar Plot) all take two input arrays: X and Y. On a rectangular plot, the X array gives the location of points along the horizontal axis, and the Y array gives the location of points along the vertical axis.
When plotting to polar axes, the X array gives the angular locations of points, in radians. The Y array gives the locations of the points in the radial direction.
This is also the case for all other VIs which interact with the plot; for example, when placing text on the plot using Add Text, the X position is interpreted as an angle, in radians.
The zero angle is on the right horizontal axis, as is common in mathematics and the physical sciences. Negative angle values are fully supported, as are values greater than 2 \pi.
Gotchas
The X input for Line Plot and friends is optional; if N data points are provided to the Y input, it defaults to 0..N-1. This may have unexpected effects on a polar plot; the points will appear at 0, 1, 2, etc., radians, which is probably not what you want. To avoid this, always specify X and Y explicitly when using polar plots.
Although points are placed in radians, the default human-readable tick labels are given in degrees (0, 90, 180, 270). You can re-label these, if desired, using Set X Ticks. Check out Using Inline Text Markup if you want to use the \pi symbol for this!
VIs Supporting Polar Plots
Not all VIs can cope with the polar coordinate system. At present, the 1D plotting routines work well, along with VIs for annotation, like Add Legend.
Here’s a list of the VIs which support polar axes. Calling other VIs with a polar plot will result in error 402905 - Operation Not Supported for Polar Plot.
Plotting
Annotation
Plot Config and Setup
- Grid Lines
- Set Axis Limits (Y limits only)
- Set Plot Size
