Advanced Plotting Toolkit
Welcome! The Advanced Plotting Toolkit is a open-source project which brings modern plotting to LabVIEW, by providing a native, stand-alone LabVIEW version of the “matplotlib” visualization library.
See Getting Started for a quick introduction to the Toolkit.
Check out the Examples section to download example VIs.
Contents
Plotting Quick Reference
 View Array |
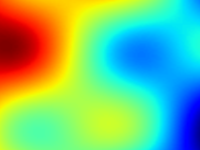
 Contour |
 Filled Contour |
|
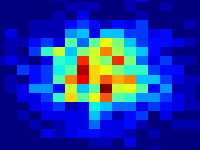 2D Histogram |
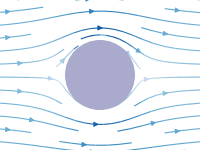 Streamlines |
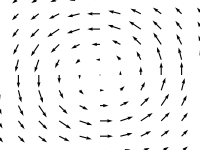 Vector Arrows |
|
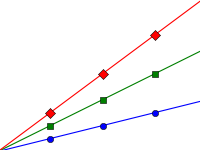 Line Plot |
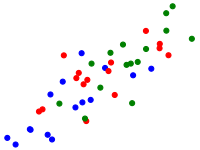 Scatter Plot |
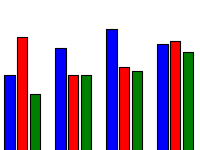 Bar Plot |
|
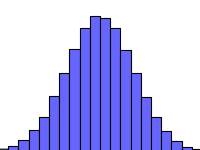 1D Histogram |
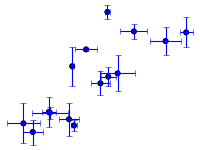 Error Bars |
 More VIs... |