Draw Horizontal Line
Draw a horizontal line across the axis box, at a particular Y location.
The starting and ending locations of the line may optionally be specified, in units of the axis width (0.0 to 1.0).
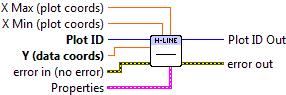

 Plot ID/Plot ID Out
- Plot identifier. Plot ID Out always contains the same value as Plot ID.
 Y (data coords)
- Y location at which to draw the horizontal line, in data coordinates.
- X Min (plot coords)
- Start location of line, as a fraction of the plot width (0 to 1). Default is to start at the left axis (0).
- X Max (plot coords)
- End location of line, as a fraction of the plot width (0 to 1). Default is to end at the right axis (1).
 Properties
Property cluster, available under the “Properties” subpalette.
 Line
LineControls the appearance of the line.
 Style
Style- Line style (solid, dashed, etc.). Default is to automatically select an appropriate style.
 Color
Color- Line color. May be a PlotColor or LabView color.
 Width
Width- Line width, in font points (1/72 inch).
- Display
Controls display appearance of the line.
- Alpha
- Alpha blending value for this object (0.0 to 1.0). Default is 1.0 (fully opaque).
- Z Order
- Stacking order. Default is chosen based on the object type.

 Error In/Out
- Terminals for standard error functionality.
Axis Types
This VI supports rectangular axes. Use with polar axes will result in 402905 - Operation Not Supported for Polar Plot.
Errors
Other information
If Y is non-finite (NaN or Inf), the line will not be displayed, and no error will be returned.
If X Min or X Max is non-finite or extends beyond the limits of the axes, the default location will be used. X Max may be smaller than X Min; the line will be plotted normally.