Streamline Plot
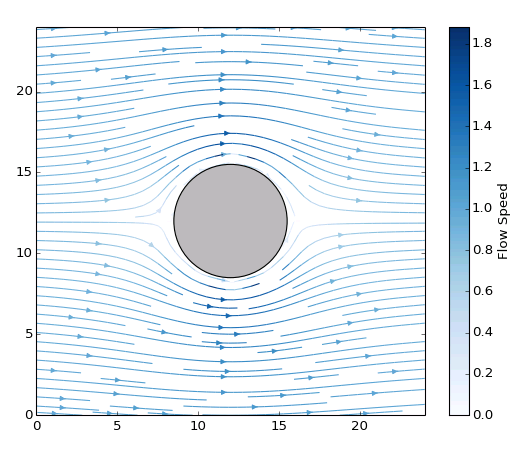
Display a vector field using streamlines.
Provide two 2D arrays, giving the X Vector Component and Y Vector Component at each point on the grid. Streamlines are automatically generated; adjust the Density setting to control how many are used.
By default, streamlines are plotted in black. If a 2D array is supplied to the Colormap Value input, its contents will be used to shade the streamlines according to a colormap. A solid color may also be specified via Line.Color. At present, line styles other than Automatic or Solid are ignored.
Note
Due to technical limitations, array dimensions of 2 and 4 are currently forbidden and will result in a blank plot; for example, a 2x9 or 7x4 shape array.
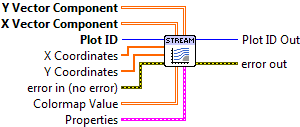

 Plot ID/Plot ID Out
- Plot identifier. Plot ID Out always contains the same value as Plot ID.
 X Coordinates
- Optional 1-D array giving X axis coordinates. Defaults to 0..NX-1, where NX is the size of the data’s second dimension. If provided, points must be monotonic and uniformly spaced, or 402907 - Coordinates Not Regular will result.
- Y Coordinates
- Optional 1-D array giving Y axis coordinates. Defaults to 0..NY-1, where NY is the size of the data’s first dimension. If provided, points must be monotonic and uniformly spaced, or 402907 - Coordinates Not Regular will result.
 X Vector Component
- X vector component at each point.
- Y Vector Component
- Y vector component at each point.
- Colormap Value
- Optional 2D array which will be used to color the streamlines, according to a colormap.
 Properties
Property cluster, available under the “Properties” subpalette.
 Density
- Scale factor controlling density of streamlines. Default is 1.
- Arrow Size
- Scale factor controlling size of arrows on the streamlines. Default is 1.
 Line
LineControls the appearance of the streamlines. At the moment, only “Automatic” and “Solid” line styles are supported; others will be ignored.
 Style
Style- Line style (solid, dashed, etc.). Default is to automatically select an appropriate style.
 Color
Color- Line color. May be a PlotColor or LabView color.
 Width
Width- Line width, in font points (1/72 inch).
- Colormap
Controls the colormap used to shade the arrows, when a Colormap Value array is given.
- Map
- Colormap to use. See Colormaps for more info.
- Value Min
- Lower range for colormapped data; values smaller than this will all be plotted with the first color in the colormap.
- Value Max
- Upper range for colormapped data; values larger than this will all be plotted with the last color in the colormap.
- Scaling
- Colormap scaling mode. Currently only linear scaling is supported.
 Reverse
- Flip the colormap; for example, if a map has 0.0 as black and 1.0 as white, this will assign 0.0 as white and 1.0 as black.

 Error In/Out
- Terminals for standard error functionality.
Axis Types
This VI supports rectangular axes. Use with polar axes will result in 402905 - Operation Not Supported for Polar Plot. Likewise, only linear scales are supported. Use with log or symlog axes will result in 402906 - Operation Not Supported for Axis Scale.
Errors
Other information
If an empty array is provided for X Vector Component or Y Vector Component, this VI does nothing.
If a non-finite value appears in X Coordinates or Y Coordinates, 402907 - Coordinates Not Regular will result. A non-finite value in X Vector Component or Y Vector Component has undefined results.
If the sizes of any of the inputs are not the same, only the overlapping region will be displayed. If a zero-size array is provided for any of X Coordinates, Y Coordinates, or Colormap Value, it will be ignored.
A non-finite or negative value for Density or Arrow Size will be ignored.
Values for Line.Style other than Automatic or Solid are currently ignored.