Add Text
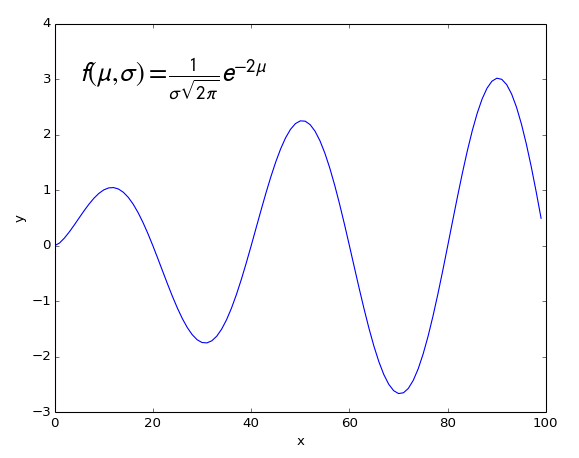
Add text to the plot.
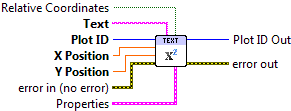
Provide a string, and X/Y positions. By default, the positions are in data units. This can be changed to width/height relative units (0.0 to 1.0) by setting the Relative Coordinates input to True.


 Plot ID/Plot ID Out
- Plot identifier. Plot ID Out always contains the same value as Plot ID.
 Text
Text- Text to display. May contain inline markup; see Using Inline Text Markup.
 X Position
- X location for the lower left corner of the displayed text.
 Y Position
- Y location for the lower left corner of the displayed text.
 Relative Coordinates
- By default, X Position and Y Position are in data units. If True, use axis-relative (0.0 to 1.0) units instead.
 Properties
Property cluster, available under the “Properties” subpalette.
 Text
TextControls text layout and options.
 Color
Color- Text color (PlotColor or LabView color).
 Background Color
- Color of text background (box directly behind the text.) PlotColor or LabView color.
 Font Size
- Size of text. Choosing a relative size (Small, Medium, Large, etc.) from the drop-down is recommended. You can also choose “Other” and specify an absolute font size (in points) manually.
 Font Style
- Style of font (normal, italic, bold).
 Rotation angle
- Angle of rotation (about left bottom corner).
 Display
Controls text display appearance.
 Alpha
Alpha- Alpha blending value for this object (0.0 to 1.0). Default is 1.0 (fully opaque).
 Z Order
- Stacking order. Default is chosen based on the object type.

 Error In/Out
- Terminals for standard error functionality.
Errors
Other information
If X Position or Y Position is non-finite (NaN or Inf), the text will not be displayed and no error will be returned.
If values are used which place the text partially or completely out of the axis box, only the portion which remains within the axis box will be displayed.
A font size of 0 will be ignored, and the default used. Negative font sizes have undefined effects.
