Set Title
Add a title to the plot.
Titles are displayed above the axis box, centered.
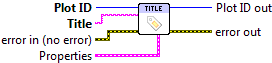

 Plot ID/Plot ID Out
- Plot identifier. Plot ID Out always contains the same value as Plot ID.
 Title
Title- Text to display. May contain inline markup; see Using Inline Text Markup.
 Properties
Property cluster, available under the “Properties” subpalette.
 Text
TextControls text layout and options.
 Color
Color- Text color (PlotColor or LabView color).
- Background Color
- Color of text background (box directly behind the text.) PlotColor or LabView color.
- Font Size
- Size of text. Choosing a relative size (Small, Medium, Large, etc.) from the drop-down is recommended. You can also choose “Other” and specify an absolute font size (in points) manually.
 Font Style
- Style of font (normal, italic, bold).
 Rotation angle
- Angle of rotation (about left bottom corner).

 Error In/Out
- Terminals for standard error functionality.